SaaS Pricing Analysis: How Dual-Layer Scoring Works
A worked example of dual-layer pricing analysis using Intercom's real data. See how tactical scoring (6 attributes) and strategic assessment (5 dimensions) combine into a single score that reveals what neither layer catches alone.
When one AI agent does the work of five humans, charging per seat punishes both buyer and seller. That's why SaaS pricing is splitting. Intercom now charges per seat AND $0.99 per AI resolution. Salesforce runs three billing models at once. The pricing page went from the simplest page on your site to the most complex.
In our SaaS pricing audit framework post, we introduced a 6-attribute scoring system for evaluating pricing pages. It scores Name, Price, Description, Period, Seats, and Features on a 0-10 scale against matched competitors. It works. It's repeatable. And it's incomplete.
A pricing page can score 7.5/10 on all six attributes and still hide strategic problems: wrong value metric, missing psychological triggers, tiers that don't map to real buyer personas, or positioning that leaves money on the table. Those problems live in a layer that attribute scoring doesn't reach.
This post introduces the second layer. We call it the Strategic Assessment, and it scores five dimensions that sit underneath the pricing page. Together with the Tactical Score, it produces a single Combined Score that gives you the full picture.
We're going to walk through both layers using real data from a real analysis: Intercom.
Why Tactical Analysis Alone Falls Short
The 6-attribute framework answers one question: "How does each tier look compared to matched competitors?" It scores what buyers see on the pricing page. That's valuable. But it doesn't score what's happening underneath.
Here's a concrete example. Intercom's Essential tier scores 6.8/10 tactically. Decent. But the tactical score doesn't tell you that Intercom's annual discount on Essential is 25.6%, while Expert's annual discount is just 5%. That swing creates inconsistent economics that confuse buyers comparing annual vs. monthly pricing across tiers. It's invisible in the attribute scores.
Another example: Intercom's Advanced tier scores 7.3/10 tactically, the second-best in the lineup. But the tactical score doesn't reveal that there's no "Most Popular" label, no visual emphasis, and no decoy framing. The tier could be doing more psychological work, and no amount of attribute scoring will surface that gap.
We were measuring the page. We needed to measure what was behind it. The tactical layer scores what's there. The strategic layer scores what's missing, what's misaligned, and what's leaving revenue on the table.
The Two Layers, Explained
Before walking through Intercom's data, here's how the two layers differ:
| Tactical Layer | Strategic Layer | |
|---|---|---|
| What it scores | 6 visible pricing page attributes | 5 underlying pricing strategy dimensions |
| Input data | Tier names, prices, descriptions, billing, seats, features | Architecture patterns, value metrics, psychology, personas, market position |
| Score range | 0-10 per attribute, averaged per tier | 0-10 per dimension, averaged overall |
| What it catches | Weak descriptions, high prices, missing features | Wrong value metric, missing psychology, poor persona fit |
| Blind spots | Can't see strategy behind the page | Doesn't score individual tier execution |
Combined Score = (Tactical Score + Strategic Score) / 2
For Intercom: (7.1 + 7.0) / 2 = 7.05
That 0.05 gap between layers tells a story. Intercom's pricing page execution is slightly ahead of its underlying strategy. The tactical polish is masking strategic gaps. Let's look at each.
Layer 1: Intercom's Tactical Scorecard
This is the 6-attribute layer from our audit framework, applied to Intercom's four pricing units (Essential, Advanced, Expert, Fin AI Agent) against Zendesk, Freshdesk, Kustomer, Gorgias, and Dixa.
Intercom Tactical Scores (6 Attributes x 4 Tiers)
| Attribute | Essential | Advanced | Expert | Fin AI Agent |
|---|---|---|---|---|
| Name | 7.0 | 7.5 | 7.5 | 7.0 |
| Price | 7.0 | 7.0 | 7.0 | 7.0 |
| Description | 6.5 | 7.0 | 7.0 | 7.0 |
| Period | 7.0 | 7.5 | 7.5 | 6.5 |
| Seats | 7.0 | 7.4 | 7.5 | 6.0 |
| Features | 6.5 | 7.5 | 8.0 | 7.0 |
| Tier Score | 6.8 | 7.3 | 7.4 | 6.8 |
Tactical Product Score: 7.1/10 (highest in the competitive set)
 Tierly dashboard showing Intercom's tactical scorecard with 6-attribute breakdown across 4 tiers
The tactical scorecard reveals a healthy pricing page. Expert leads at 7.4 with the best Features score (8.0). Essential and Fin AI Agent share the floor at 6.8, dragged by weaker Description and Seats scores respectively. No tier scores below 6.5 on any attribute.
If this were the only layer, you'd conclude: "Intercom's pricing is solid. Minor improvements on descriptions and Fin's seat messaging. Move on." You'd be wrong.
Layer 2: Intercom's Strategic Assessment
The Strategic Assessment scores five dimensions that the pricing page doesn't show you directly. Each dimension is scored 0-10 based on competitor benchmarks, market data, and pricing research.
Intercom Strategic Scores (5 Dimensions)
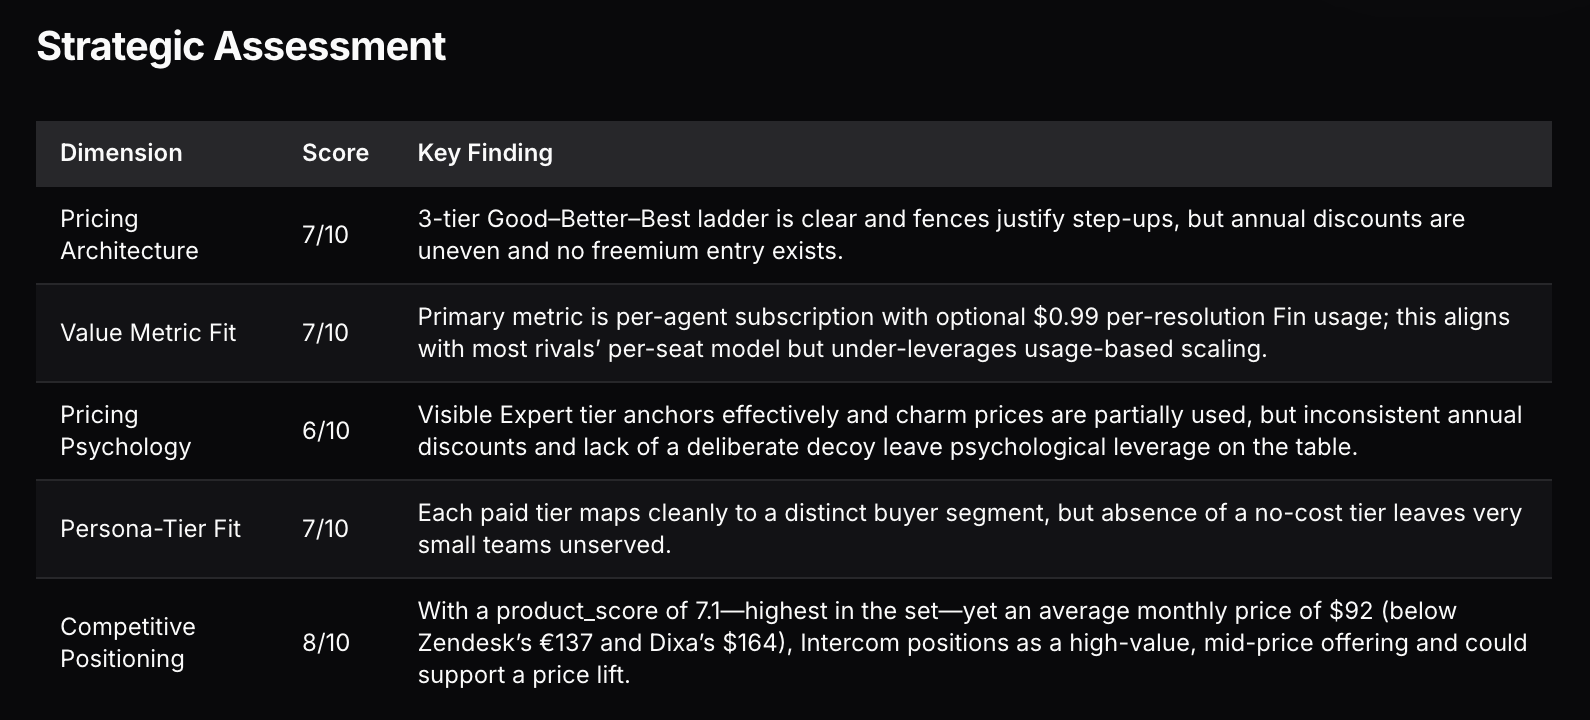
| Strategic Dimension | Score | Key Finding |
|---|---|---|
| Pricing Architecture | 7/10 | Clean 3-tier ladder, but annual discounts swing 25.6% to 5% |
| Value Metric Fit | 7/10 | Per-seat + per-resolution hybrid, but usage scaling under-developed |
| Pricing Psychology | 6/10 | Partial charm pricing, no decoy labeling, inconsistent discount pull |
| Persona-Tier Fit | 7/10 | Clean persona mapping, but no free tier leaves entry-level gap |
| Competitive Positioning | 8/10 | Highest score in set at lower-than-premium price, room to increase |
Strategic Score: 7.0/10
The strategic layer tells a different story from the tactical one. Let's walk through each dimension using Intercom's real data.
✦ Dimension 1: Pricing Architecture (7/10)
Pricing Architecture evaluates the structural skeleton of your pricing: How many tiers do you have? Are step-up ratios between tiers justified? Are the fences between tiers strong enough to prevent downgrades and encourage upgrades?
What Intercom gets right:
⦿ Three paid tiers follow Good-Better-Best convention. Essential, Advanced, Expert. Buyers understand this ladder instinctively. Zendesk uses 4+ tiers in its Suite lineup. Freshdesk also uses 3 paid tiers. Three is the market norm for this category.
⦿ The Expert fence is strong. SSO, HIPAA, SLAs, and 50 Lite seats gate the jump from Advanced ($99) to Expert ($139). That's a 1.4x step-up with enterprise-grade justification. Fence strength: 8/10.
⦿ Fin AI Agent exists as a separate pricing unit. Rather than bundling AI into tiers (like Zendesk), Intercom decoupled it at $0.99/resolution. This is an architectural choice with major implications for value capture as AI usage grows.
Where the architecture weakens:
☒ The Essential-to-Advanced step-up is 2.5x ($39 to $99). That's a large jump. The fence includes 20 Lite seats, workflow automation, and multilingual Help Center. Those are strong features, but a $60/month increase needs either a visible "Most Popular" badge or intermediate pricing to soften the gap.
☒ Annual discounts are structurally inconsistent. Essential offers 25.6% off for annual billing ($39 monthly, $29 annual). Advanced offers 14.1%. Expert offers just 5%. This creates bizarre economics: the most price-sensitive buyers (Essential) get the best annual deal, while the highest-paying buyers (Expert) get almost no incentive to commit annually. Pricing research recommends harmonizing around 17% across all tiers.
Architecture score: 7/10. The ladder is clear and fences are solid, but discount inconsistency and a steep entry step-up cost points.
✦ Dimension 2: Value Metric Fit (7/10)
Per-seat pricing isn't dying. It's splitting into two dimensions. Seats measure who has access. Usage metrics (credits, workflow runs, AI resolutions) measure what gets done. Value Metric Fit scores whether you're charging on the right axis for your product.
Intercom's value metric structure:
| Component | Metric | How It Scales |
|---|---|---|
| Paid tiers (Essential, Advanced, Expert) | Per seat/month | Linear with headcount |
| Fin AI Agent | Per resolution ($0.99) | Linear with AI usage volume |
| Lite seats (Advanced: 20, Expert: 50) | Bundled free | Step function at tier upgrade |
This is a hybrid model. The human side of the product charges per seat. The AI side charges per outcome. That's a forward-looking bet. Gartner forecasts that 40% of enterprise SaaS will include outcome-based pricing elements by 2026, up from 15% a few years ago. Intercom is already there.
Where it scores 7 instead of 9:
The per-seat component doesn't scale elegantly with team growth. Once a customer uses all 20 bundled Lite seats on Advanced, the only path is buying more seats individually or upgrading to Expert for 50. There's no intermediate bundle (e.g., packs of 5 Lite seats at a discounted rate). This leaves expansion revenue on the table.
Competitors show the range of metrics in this market:
| Competitor | Primary Metric | Product Score |
|---|---|---|
| Intercom | Per seat + per resolution | 7.1 |
| Zendesk | Per seat | 6.7 |
| Freshdesk | Per seat | 6.7 |
| Gorgias | Ticket volume | 6.5 |
| Kustomer | Per seat | 6.6 |
| Dixa | Per seat | 6.7 |
Intercom is the only player running two value metrics simultaneously. Gorgias is the only other competitor not using per-seat as its primary metric (they use ticket volume). The rest are pure per-seat. Intercom's hybrid approach is differentiated, but the seat-scaling mechanism needs work.
✦ Dimension 3: Pricing Psychology (6/10)
Pricing Psychology scores how well your pricing page uses behavioral economics: anchoring, charm pricing, decoy effects, and annual discount framing. This is the dimension where Intercom leaves the most on the table.
What the data shows:
⦿ Anchoring works. Expert at $139/month sets a visible ceiling. Buyers see the top price first (if the page displays high-to-low) and feel better about the $99 Advanced tier. Anchoring is present and functional.
⦿ Charm pricing is partial. $39 and $99 end in 9 (classic charm pricing). But $139 is a round number, breaking the pattern. And annual prices ($29, $85, $132) don't follow charm pricing at all. The inconsistency dilutes the psychological effect.
☒ No decoy labeling. Intercom's Advanced tier at $99 sits naturally in the "Most Popular" position (middle tier, strong feature upgrade from Essential). But there's no visual badge, no callout, no highlighted column. Research shows the middle tier typically drives 60-70% of revenue when properly framed. Intercom is leaving that nudge unused.
☒ Annual discounts work against psychology. The 25.6% Essential discount makes annual feel like a steal. The 5% Expert discount makes annual feel like an afterthought. If you're an Expert buyer comparing monthly vs. annual, $139 vs. $132 is only $7/month savings. That's not enough to trigger the "lock in and save" response that annual pricing is supposed to create.
Psychology score: 6/10. The weakest strategic dimension. Basic tactics are present but applied inconsistently, and the biggest lever (decoy framing) is completely unused.
What gets measured gets managed.
And what gets scored gets fixed. Most pricing pages deploy psychology by accident (someone happened to choose $99 instead of $100). Scoring it systematically turns instinct into data.
✦ Dimension 4: Persona-Tier Fit (7/10)
Persona-Tier Fit measures whether each tier serves a distinct buyer persona, and whether the mapping is clean or muddy.
Intercom's persona mapping from Tierly's analysis:
| Tier | Target Persona | Fit Score | Key Signal |
|---|---|---|---|
| Essential ($39) | Solo support operator / startup | 8/10 | Description says 'individuals, startups, and small businesses' |
| Advanced ($99) | Growing multi-agent team needing automation | 8/10 | 20 Lite seats + workflow builder signals team scale |
| Expert ($139) | Enterprise with compliance needs | 8/10 | SSO, HIPAA, SLAs gate enterprise requirements |
| Fin AI Agent ($0.99/res) | External helpdesk user wanting AI | 7/10 | Works with Zendesk and Salesforce, but persona is less defined |
Why this scores 7 instead of 8:
The three paid tiers map cleanly. Each description explicitly names its persona. The feature fences reinforce the mapping. A startup founder browsing Intercom's pricing page can identify their tier in seconds. That's good.
But there's a gap at the bottom. Freshdesk offers a Free tier covering 1-2 agents. Intercom doesn't. This means the smallest possible teams (a solo founder handling support themselves) must pay $29/month from day one. That's not expensive. But it creates a missing rung in the persona ladder. The journey goes from "I'm not an Intercom customer" directly to "I pay $29/month." Freshdesk's Free tier captures those early-stage users first, and some of them never switch.
The Fin AI Agent persona is also looser. It targets "customers on other helpdesks wanting AI without switching core tooling." That's a real persona, but the pricing page doesn't communicate it as clearly as the three paid tiers communicate theirs.
✦ Dimension 5: Competitive Positioning (8/10)
Competitive Positioning is Intercom's strongest strategic dimension. It scores where you sit in the market's price-vs-value landscape and whether your position makes strategic sense.
Intercom's position in the market:
| Product | Avg Price/mo | Tierly Score | Position |
|---|---|---|---|
| Gorgias | $277.50 | 6.5 | Premium (high price, lower score) |
| Dixa | $164.30 | 6.7 | Premium |
| Zendesk | $137.70 | 6.7 | Premium |
| Intercom | $92.00 | 7.1 | Value (highest score, mid price) |
| Kustomer | $67.20 | 6.6 | Value |
| Freshdesk | $61.30 | 6.7 | Budget |
 Tierly competitive positioning map showing Intercom at highest score with mid-range pricing vs premium competitors
This is the strongest signal in the entire analysis. Intercom has the highest product score (7.1) while charging less than Zendesk ($137.70), Dixa ($164.30), and Gorgias ($277.50). In pricing strategy terms, Intercom is under-monetizing relative to its competitive position.
Tierly's analysis flagged a price increase opportunity: "Intercom's 7.1 product score tops the field while its $92 average price is 33-44% below premium peers." A modest $5-10 increase on Essential and Advanced for new customers (with grandfathering for existing users) would capture that headroom without churn risk.
Positioning score: 8/10. Intercom occupies the best position in its competitive set. Points lost only because the under-monetization suggests the current position is accidental rather than deliberate.
The Combined Score: What It Reveals
Here's Intercom's full dual-layer picture:
Intercom Dual-Layer Scorecard
| Layer | Component | Score |
|---|---|---|
| Tactical | Product Score (avg of 4 tier scores) | 7.1/10 |
| Strategic | Pricing Architecture | 7/10 |
| Strategic | Value Metric Fit | 7/10 |
| Strategic | Pricing Psychology | 6/10 |
| Strategic | Persona-Tier Fit | 7/10 |
| Strategic | Competitive Positioning | 8/10 |
| Strategic | Strategic Score (avg of 5 dimensions) | 7.0/10 |
| Combined | (Tactical + Strategic) / 2 | 7.05/10 |
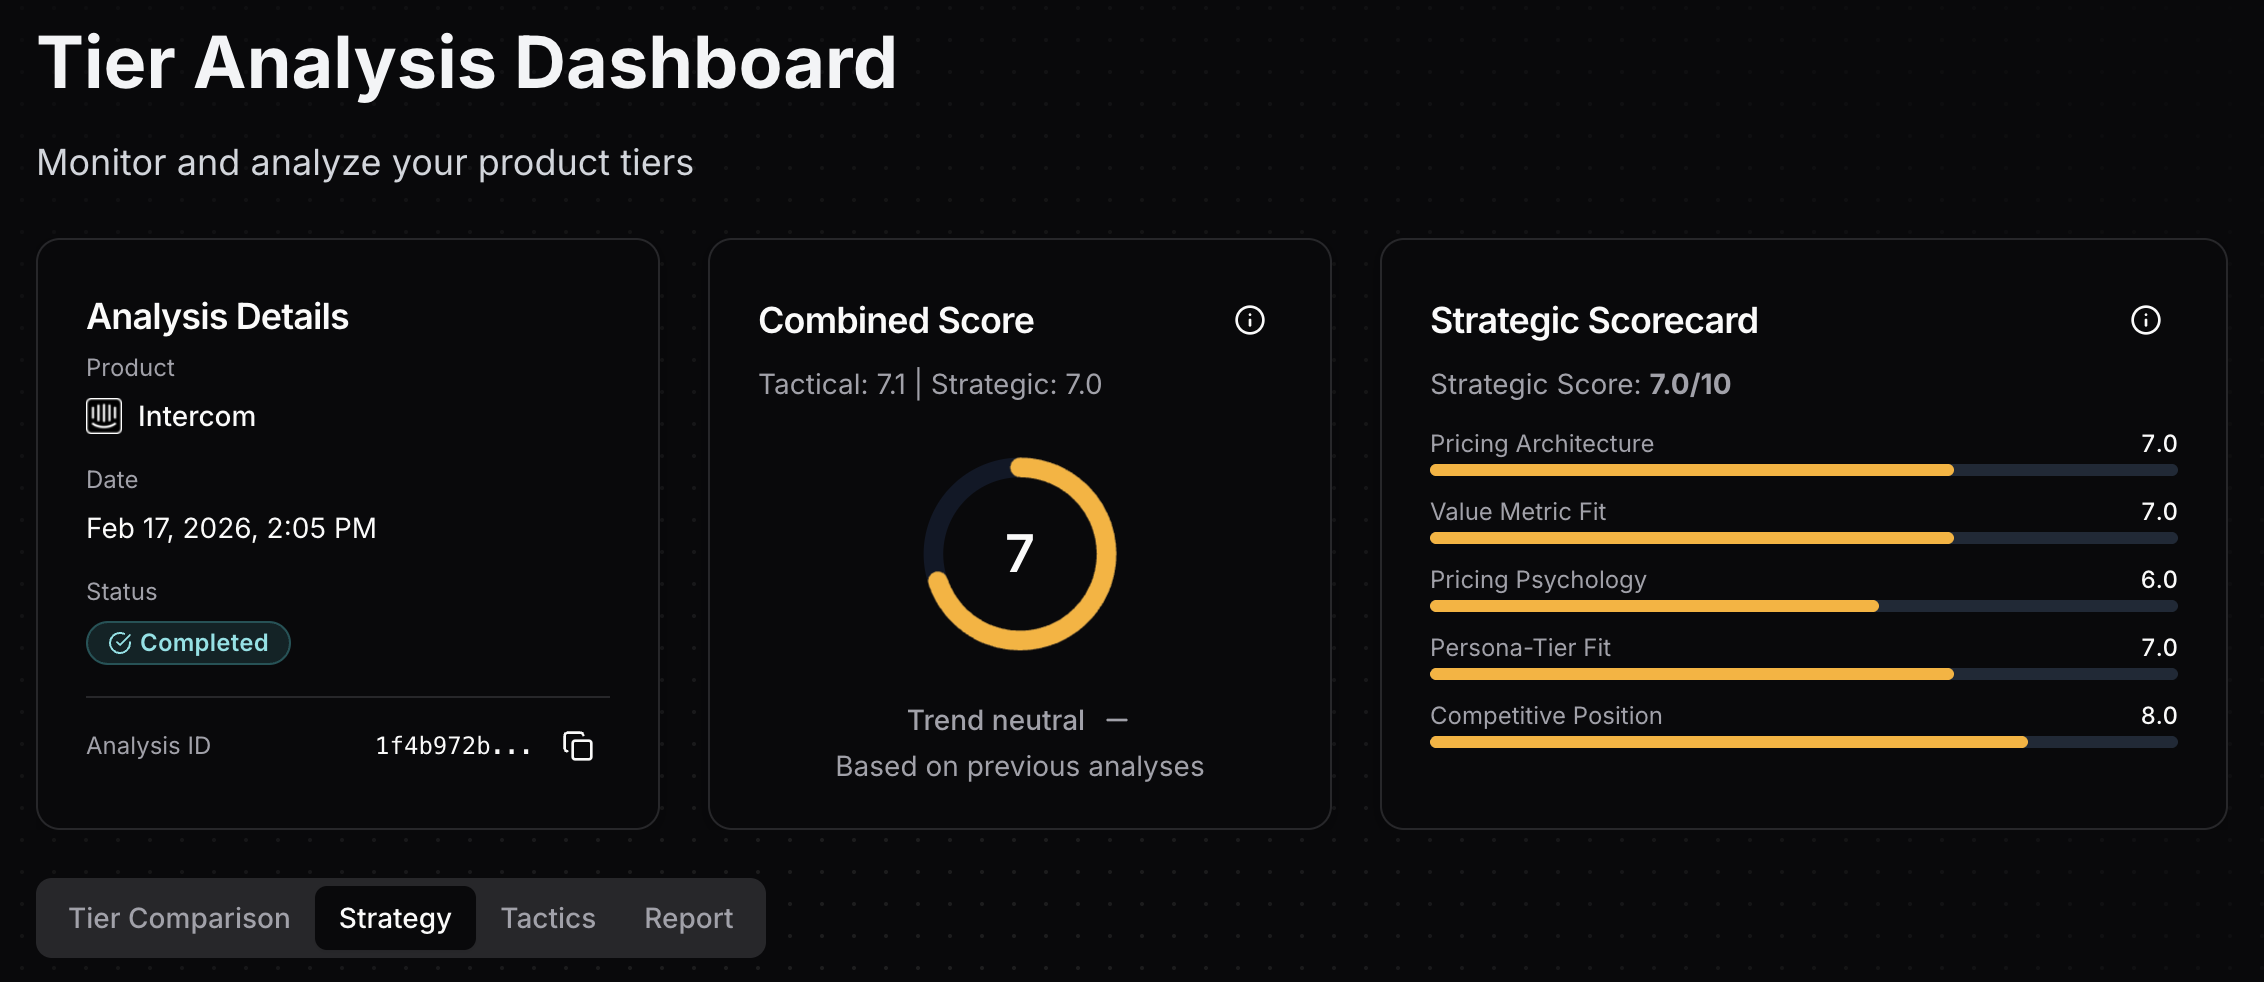 Tierly combined score dashboard showing Intercom's 7.05 with tactical and strategic breakdown
The 0.1-point gap between Tactical (7.1) and Strategic (7.0) is small, but the composition tells a story:
⦿ Tactical consistency is high. No tier scores below 6.8. No attribute scores below 6.0. The pricing page is well-executed across the board.
⦿ Strategic variance is wide. Competitive Positioning scores 8, but Pricing Psychology scores 6. That's a 2-point spread. The strategic layer reveals that Intercom's market position is stronger than its pricing page takes advantage of.
⦿ The combined score hides the opportunity. A Combined Score of 7.05 sounds solid. And it is. But it masks the fact that fixing Psychology from 6 to 7.5 and adding a free tier to improve Persona-Tier Fit from 7 to 8 would push the Combined Score to 7.5+, pulling ahead of every competitor by an even wider margin.
That's what dual-layer analysis is for. The tactical score says "your pricing page is fine." The strategic score says "your pricing strategy could be much better." The combined score quantifies the gap.
What Dual-Layer Catches That Single-Layer Misses
Here are three specific insights from Intercom's analysis that only surface when you score both layers:
✦ Insight 1: The Annual Discount Contradiction
Tactical layer: All four tiers score 6.5-7.5 on the Period attribute. Looks fine.
Strategic layer: Annual discounts range from 25.6% (Essential) to 5% (Expert). The pricing psychology dimension catches this as a problem: inconsistent discounts weaken annual commitment incentives for high-value buyers.
What a founder should do: Standardize annual discounts around 17% across all tiers. This means raising Essential's annual price slightly and lowering Expert's annual price. The result is more annual commitments from Expert buyers (higher LTV) and clearer economics across the board.
✦ Insight 2: The Missing Decoy
Tactical layer: Advanced scores 7.3/10. Strong Description (7.0), strong Features (7.5). No red flags.
Strategic layer: Pricing Psychology catches that Advanced has no "Most Popular" badge despite sitting in the natural decoy position. Middle tiers drive 60-70% of revenue when labeled. This is free conversion lift that the tactical score can't detect.
What a founder should do: Add "Most Popular" to the Advanced tier. Visually highlight it on the pricing page. This is a zero-cost change that typically shifts 10-15% of Essential buyers upward.
✦ Insight 3: The Positioning Headroom
Tactical layer: Price attribute scores are all 7.0/10 across tiers. Competitive. No alarm.
Strategic layer: Competitive Positioning reveals that Intercom's $92 average is 33-44% below premium competitors (Zendesk at $137, Dixa at $164) while having the highest product score. There's real pricing power being left uncaptured.
What a founder should do: Test a $5-10 price increase on new customers. Grandfather existing users. Monitor conversion rates. The strategic layer provides the evidence that the market can bear it.
How to Read a Combined Score
Not all 7.05 scores are equal. The composition matters. Here's how to interpret what you see:
Combined Score Interpretation Guide
How to read dual-layer results
When Tactical > Strategic (like Intercom: 7.1 vs 7.0)
Your pricing page is well-executed but your strategy has gaps. The page looks good, but you're likely missing revenue opportunities. Priority: Fix strategic dimensions (psychology, architecture, positioning).
When Strategic > Tactical
Your strategy is sound but your pricing page doesn't reflect it. You have the right tiers, the right value metric, and good positioning, but the page itself has weak descriptions, confusing names, or poorly scored features. Priority: Redesign the pricing page to match the strategy.
When Both Layers Are Balanced (within 0.3 points)
Your execution matches your strategy. Focus on raising both together. Look for the lowest-scoring individual attribute or dimension as your best opportunity for improvement.
When Combined Score Is Below 6.0
Significant structural problems on both layers. Don't tweak. Redesign the pricing architecture and page together.
How to Run a Dual-Layer Analysis Yourself
The tactical layer is manual-friendly. We covered how to run a 6-attribute audit in the previous post. The strategic layer is harder to do by hand, but here's the framework:
⦿ Pricing Architecture. Count your tiers. Calculate step-up ratios between each adjacent tier. Map the fences (features that justify each step-up). Compare annual discount percentages across tiers. Score 0-10 based on how clean and consistent the structure is.
⦿ Value Metric Fit. Identify your primary billing metric (per seat, per usage, flat rate). Compare it to what competitors charge on. Ask: does your metric scale with the value customers get? Score 0-10 based on alignment.
⦿ Pricing Psychology. Check for anchoring (is the highest tier visible?), charm pricing ($99 vs $100), decoy framing ("Most Popular" label), and annual discount consistency. Score 0-10 based on how many psychological levers are actively used.
⦿ Persona-Tier Fit. For each tier, write down the target persona in one sentence. If you can't, the mapping is unclear. Check whether descriptions, features, and pricing align with that persona. Score 0-10 based on clarity and completeness.
⦿ Competitive Positioning. Plot your average price against your tactical score on a simple 2x2 (price high/low, score high/low). Identify whether you're premium, value, or budget. Check if that position is intentional. Score 0-10 based on strategic coherence.
Average all five dimension scores for your Strategic Score. Then combine with your Tactical Score for the full picture.
The manual approach takes a full day of competitor research. We built both layers into Tierly's analysis engine so you can get scored results in minutes. But the framework works regardless of how you run it.
Get an instant tactical score on any SaaS pricing page. See how your tier names, prices, features, and more compare to competitors. No signup required.
FAQ
What is dual-layer pricing analysis?
How is a SaaS pricing analysis score calculated?
What are the 5 strategic pricing dimensions?
Why isn't tactical pricing analysis enough?
How does Intercom score in dual-layer pricing analysis?
Can I run a dual-layer pricing analysis on my own product?
The Full Picture, Not Half of It
Pricing analysis has been stuck in one layer for too long. Most tools track competitor prices. Some score pricing page attributes. Almost none evaluate the strategic dimensions underneath.
The Intercom case study shows exactly why both layers matter. A 7.1 Tactical Score looks strong. But the 6/10 Pricing Psychology dimension and the annual discount inconsistency reveal opportunities that tactical scoring alone would never surface. The 8/10 Competitive Positioning dimension shows pricing power that the page isn't capturing.
The Combined Score of 7.05 is one number, but the story is in the gap between layers and the variance within them. That's what makes it real intelligence, not just a number.
The tactical layer explained. Learn the 6-attribute framework with a real Airtable worked example.
The full Intercom pricing teardown with 5 strategic lessons, competitor comparisons, and AI recommendations.
Compare the top tools for competitive pricing analysis, including AI-powered platforms that score both layers.
Related Posts

How to Audit Your SaaS Pricing Page (6-Attribute Framework)
A practical 6-attribute scoring framework for auditing SaaS pricing pages, with a real Airtable worked example showing exactly how to evaluate tier names, prices, descriptions, billing periods, seats, and features against competitors.

What is Competitive Pricing? A SaaS Founder's Guide (2026)
Competitive pricing is the most common starting point for SaaS founders, but most get it wrong. This guide covers what competitive pricing actually means in SaaS, when it works, when it backfires, and how to use competitor data without letting it dictate your strategy.
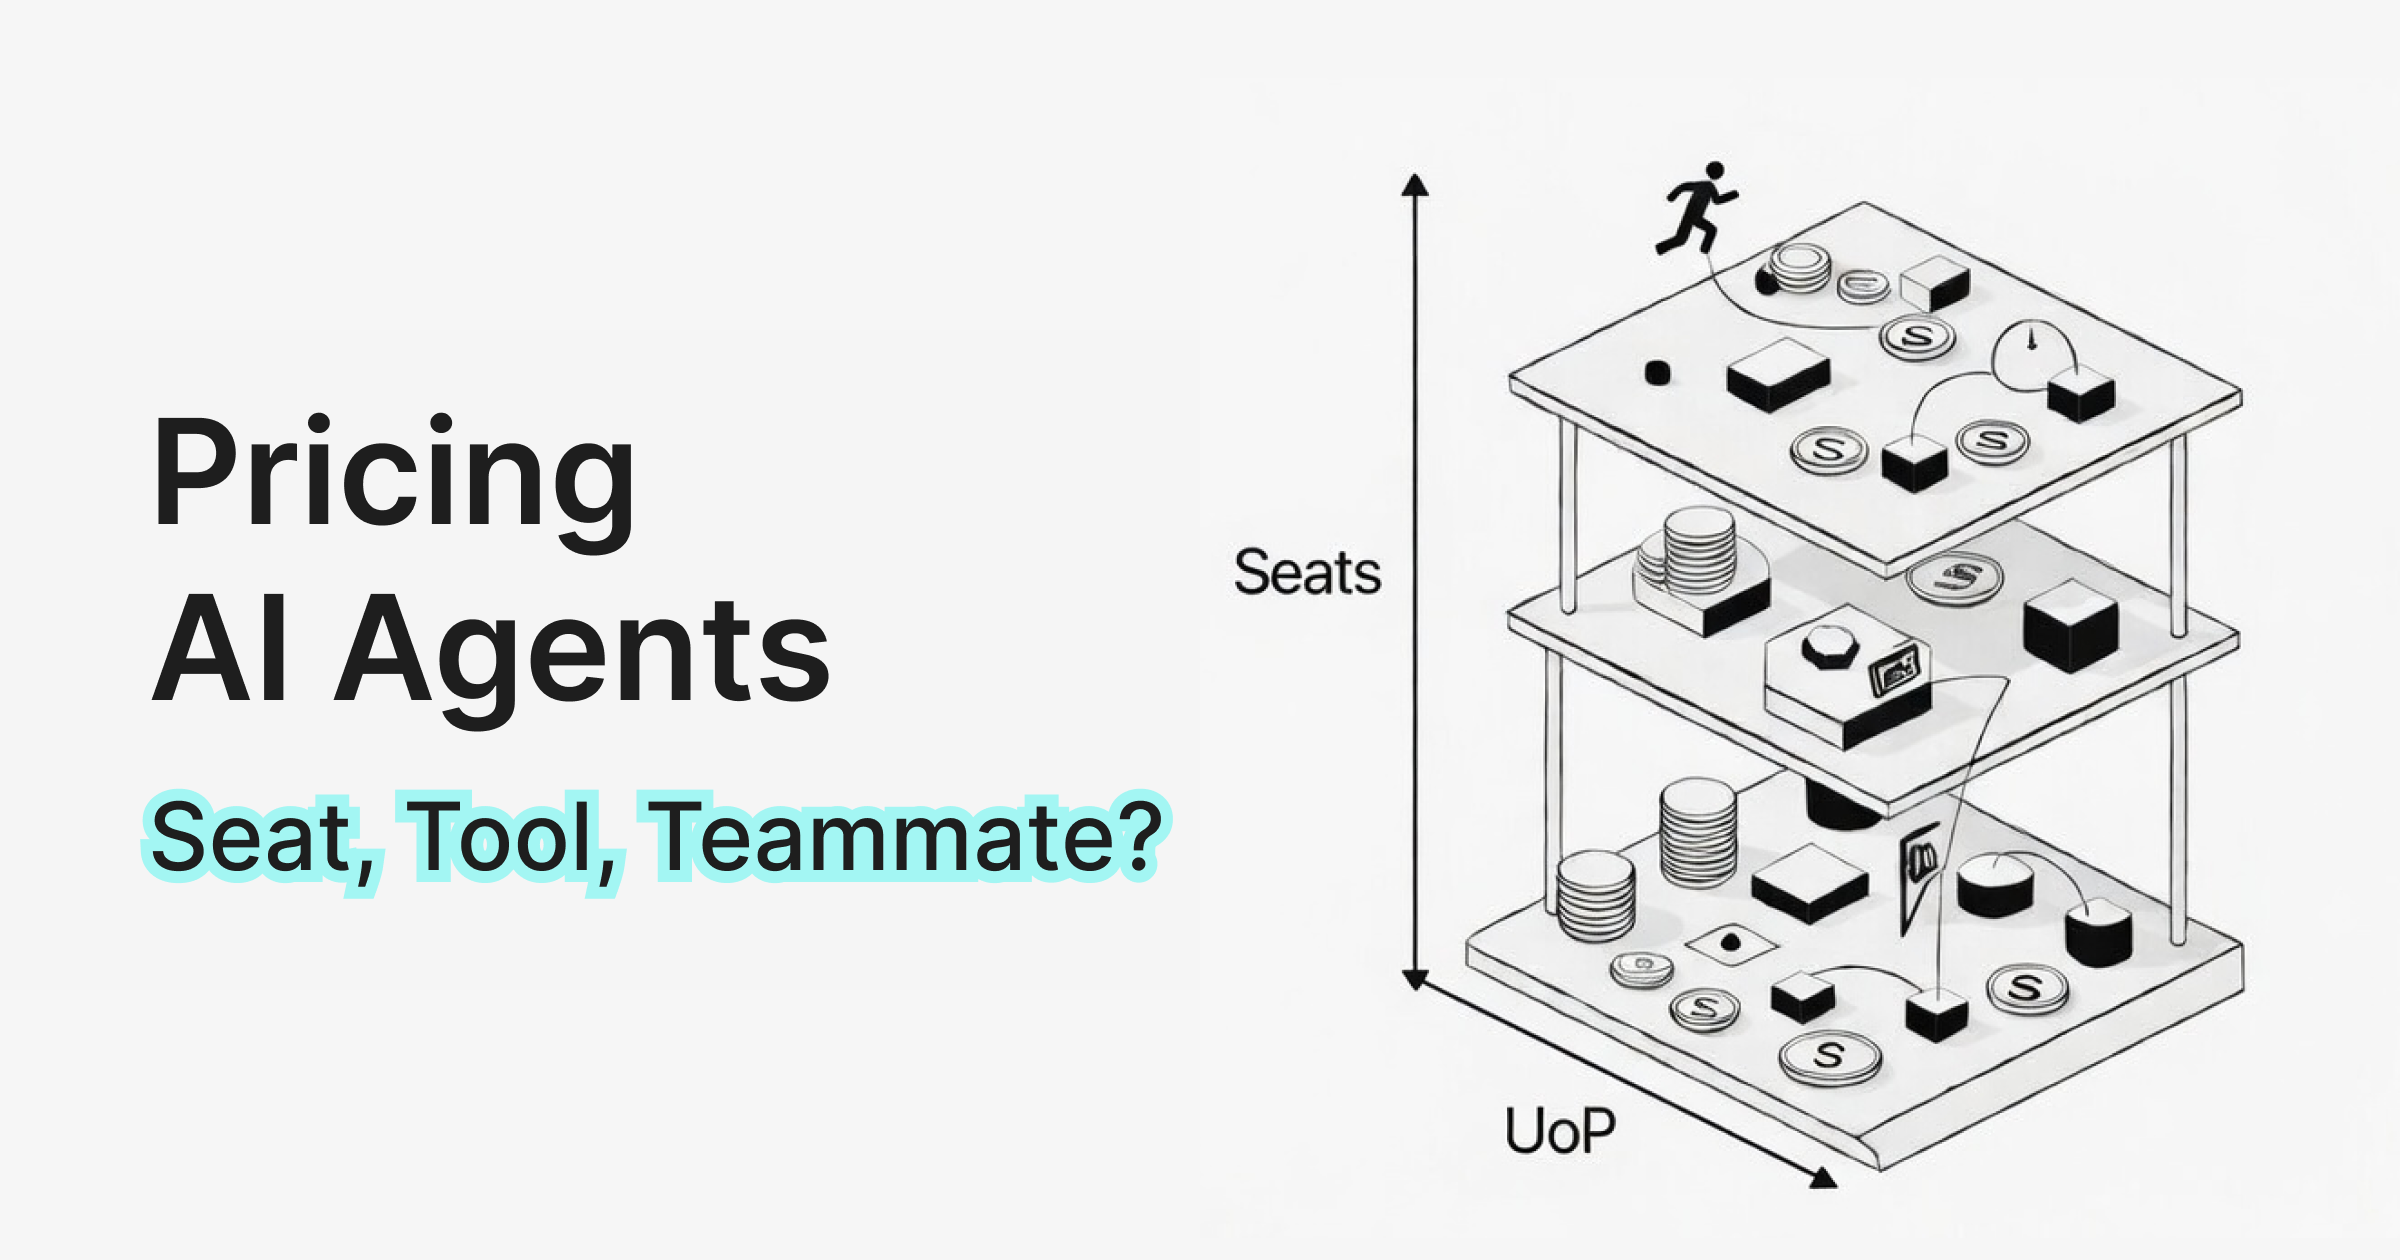
How to Price AI Agents: Seat, Tool, or Teammate?
Most AI agent pricing fails because founders pick a billing model before deciding what their agent actually is. This framework gives you a structured way to classify your agent and match it to the right pricing architecture.